How I'm Trading Newmont Corp. (NEM)
My NEM covered calls were exercised Thursday and I sold the gold miner's stock at a small profit. This week I will sell more NEM puts and may do a bullish NEM vertical call spread trade.
By Donald E. L. Johnson
Cautious Speculator
Investors looking for shelter in these markets are thinking about buying gold or gold and other precious metals miners.
Instead of buying gold futures or gold and paying for storage and insurance on the gold, I prefer to trade a blue chip gold miner’s stock. NEM pays me about a 3% dividend to own it and I can sell puts and calls on the stock to generate premium income.
Dividend stock traders who sell covered calls and cash secured puts to generate additional income might look at Newmont Corp. and its options.
I am short some NEM puts and may do some other Newmont trades to generate income. Selling puts at a strike where I would like to buy it lets me trade to get a discount on the stock if the puts are assigned.
Newmont Corp. (NEM) is a moderately bullish dividend stock and its options offer income investors opportunities to profitably sell covered calls and cash secured puts for enhanced weekly and monthly options premium income.
So far this year, annualized returns on risk (AROR) on my NEM covered calls trade have been between 17% and 42%. On my NEM puts trades, the ARoR has ranged from 8.5% and 11.9%. So I’m beating inflation on these trades. No guarantees, of course.
NEM’s Technicals
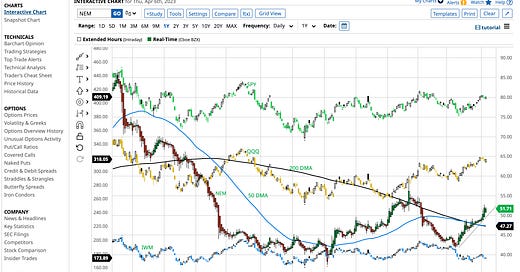
The above chart shows that the S&P 500 (SPY) and Nasdaq (QQQ) are dipping a bit while NEM looks like it is ready for a dip. The Russell 2000 (IWM) continues to slide, which is a bearish leading indictor for all of the stock markets. Charts and other historical technicals and metrics are not predictive, but they give investors a feel for market sentiment.
The mean target price for NEM is $56.74. The high target is $70 and the low target is $39. Analysts rate NEM a moderate buy, which is good for covered calls and puts traders.
The implied volatility is a moderately expensive 0.397 compared with last October’s high IV of about 0.55 and compared with the historical volatility, which is 0.35. This means call and puts premiums are relatively high, which is where and when you want to sell them.
NEM’s relative strength compared with the S&P 500 index is an over bought 0.73, which means it may be headed for a dip near term. That is good for covered calls sellers, a little risky for puts sellers.
NEM’s Fundamentals
Fundamentally, NEM’s earnings have been disappointing recently, but it is expected to report higher earnings in fiscal years 2023 and 2024.
Two indications that NEM is a popular gold mining stock these days is that its PE ratio is a fairly high 27.4 and, according to StockRover.com, its price to free cash flow is a rich 38. That is right up there with Microsoft (MSFT) at 36.7 and McDonald’s (MCD) at 38.2 versus Caterpillar (CAT) at 21 and Chevron (CVX) at 8.6.
Gold Futures vs. NEM
At midnight, Jan. 1, 1995, the first day trading gold and gold futures was legal in the United States, I was on the Chicago Board of Trade floor watching the CBOT’s new gold futures contracts open in the gold pit. The CBOT contract never had a chance because the Comex had a lock on metals futures trading and its gold futures contracts thrived. Now, the Chicago Mercantile Exchange (CME) owns both exchanges and many others.
Since then, I’ve viewed gold as another volatile commodity, not as a hedge against anything. The gold futures market is where gold miners, speculators, dealers and gold fabricators can speculate and hedge their risks.
Although I’ve covered the agricultural and metals spot and futures markets off and on for decades, I don’t trade them because they feel too risky for me. I prefer to trade the related stocks and options. We all have to know our limits as traders and risk takers.
My NEM Trades
I’ve been trading NEM and its options for a long time. Last week my NEM 4.6.23 calls were exercised at a 4.6% short term profit at the $51 strike price when the stock closed at $52.05. I bought the stock for $49.
These are the NEM covered calls trades I’ve done so far this year. Click on the images and zoom in for better views.
Selling Cash Secured Puts
I want to buy NEM back at $49. These are the puts trades that I’ve done so far and I have a NEM 4.21.23 $44 strike puts trade on that I did on March 31.
This week I plan to sell more NEM 4.28.23 expiration $49 puts. This will give me additional premium income while I wait for NEM to dip.
If NEM doesn’t drop below the $49 puts strike price by the time the puts options expire on April 28, the puts options will expire worthless and I'll pocket the premiums. Then I’ll sell the puts again. Meanwhile, NEM might run away on me, which will raise my cost of buying the stock back. That’s a risk I’m willing to take.
Selling Covered Calls
When the puts are exercised, I will sell covered calls again. This process is called “trading the wheel”.
I also might buy NEM for somewhere around $52 and sell NEM 4.14.22 expiration $54 strike covered calls for about $0.38. That would give me an annualized return on risk of about 37%, not including a potential gain if the calls are exercised. The delta on this trade is 0.24. That means that there is a 24% probability that the option will expire when the stock is at $54.01 or higher. If the stock is called my ARoR will be even higher. That is what I hope will happen.
Vertical Bull Call Spread
Another possible trade that would require a lot less capital than selling puts or doing a buy/write covered call trade would cost is to do a NEM bullish vertical call spread trade.
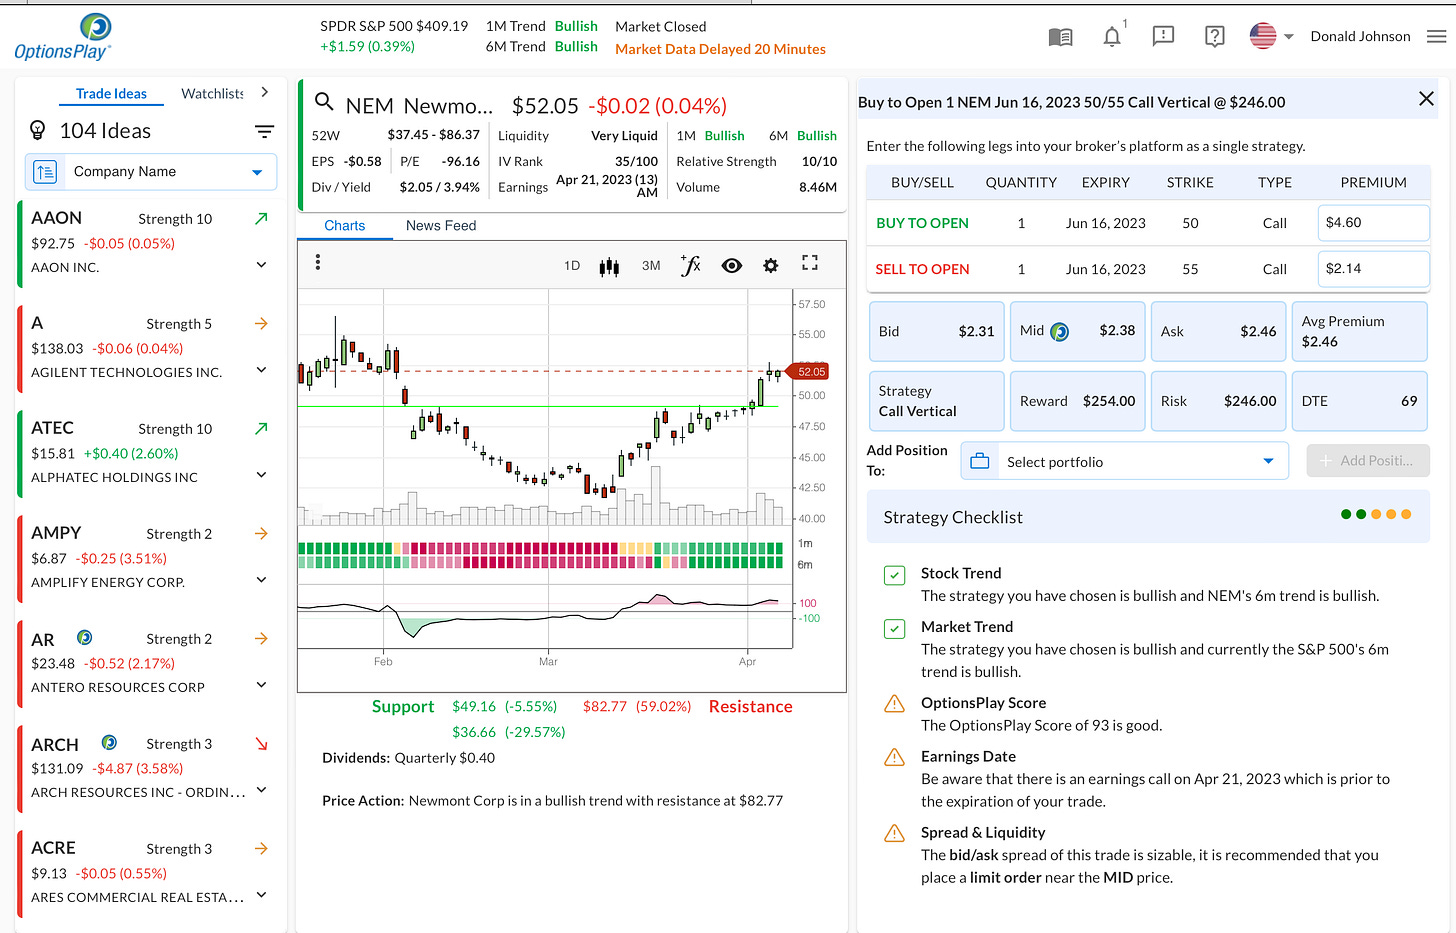
This Barchart.com table shows a NEM 6.16.23 expiration $50/$55 bullish call trade. In this trade, the investor buys 1 NEM 6.16.23 $50 strike call option for $4.60 per share in a 100-share contract. At the same time and in a single trade, the investor sells 1 NEM 6.16.23 $55 strike call for about $2.14. The average premium cost on the trade would be about $2.46, or $246 per spread.
The idea is to buy the spread for the mid point between the bid and ask prices for the net premium.
The above Barchart table shows that the probability the trade will succeed is about 46%. But a lot can happen during the 68 days duration of the trade. Most spread traders take profits at about a 50% gain and take losses at about 50%. The sooner the trade works and is closed, the higher the annualized return on risk.
The trick is to do more winning than losing spread trades and do small trades instead of one big one. I don’t like to lose money so I don’t do many vertical spread trades. I try to keep my trading simple by just selling covered calls and puts.
AROR is much lower on covered calls and puts trades, but the probability that those options won’t be exercised and will be profitable also is much higher than vertical spread trades are. All of these trades are risky one way or another.
This OptionsPlay.com calculator shows how to do and assess the bullish NEM vertical call trade.
Stock Picking, Options Trading for Income is meant to be educational, not trading advice.
LINKs:
Home Page. See my more than 100 articles on options trading, stocks and watch lists. If you read several of these articles, you’ll learn how my strategies are meant to work. No guarantees. Links to useful web sites are on the lower right corner of the home page. Scroll down.
Follow @realDonJohnson on twitter.com and FaceBook.com.
Selling in The Money Covered Calls Can Yield Big Annual Returns on Risk. By Donald E. L. Johnson
20 Ideas for Adjusting Your Stock and Bond Portfolio, by Christina Lourosa-Ricardo.
How to Beat Inflation Tax, Bear Market Tax With Dividend Stocks, Covered Calls, Cash Secured Puts, by Donald E. L. Johnson.
Wars Breed Inflation, Rising Interest Rates, Market Turmoil, By Donald E. L. Johnson.
Ways to use StockRover.com to analyze stocks
Calls vs Puts Options: What’s the Difference?
A video on how to place options trades on TDAmeritrade.com’s Think or Swim trading platform.


4.10.23. I sold NEM 5.5.23 $48 strike puts for $0.89. RoR will be about 1.747%, or 25.5% ARoR if the same kind of trade with the same RoR can be done 15 times in the next 12 months. The strike delta is -.27. The OTM probability is 69.4%. The IV is 41% and the IV rank is 35/100. RSI at OptionsPlay.com is 10/10, or overbought. If the stock is assigned at the $48 strike price, the net debit will be $47.11. The dividend yield will be about 3.481%.