Cash Secured Puts Are Sold By Investors Seeking To Buy Stocks At Discounts And To Generate Options Premium Income
Selling cash secured puts in a bear market can be very risky, especially if they are sold near at the money strikes and high deltas.
By Donald E. L. Johnson
Cautious Speculator
Selling cash secured puts for discounts and options premium income is a bullish trade that works best on stocks and ETFs with bullish momentum and price objectives.
Investors who sell puts prefer to do so in bull markets, but income traders can generate income with moderate to high risks in bear markets.
Instead of picking stocks and predicting markets, I am showing the stocks I think will be good trades. But over time, some of today’s bullish stocks will turn bearish and a few bearish stocks will rally.
Scroll down to see my spreadsheet, which I use to calculate risks and returns and to track trades.
Selling puts is a bullish trade because the seller contracts to buy a stock at the strike price when the puts option expires with the stock below the strike price.
At the same time, selling puts is an income trade when the puts strike is at a low delta and a high probability that the stock will be out of the money (OTM) and won’t be assigned when the puts options expire.
My Trades
Since Dec. 21, I did 22 bullish income trades on 19 mostly big and mega cap dividend stocks and one dividend ETF that I want to buy at discounts from the stocks’ prices at the time the trades were filled.
Nine of the 20 stocks have the equivalent of buy Stock Charts Technical momentum ratings above 60 out of a possible 100. Four others have ratings of 45.3 to 53.7, which are weaker buy ratings. Six of the stocks have the equivalent of sell ratings below 40. Please click on images and zoom in for better views.
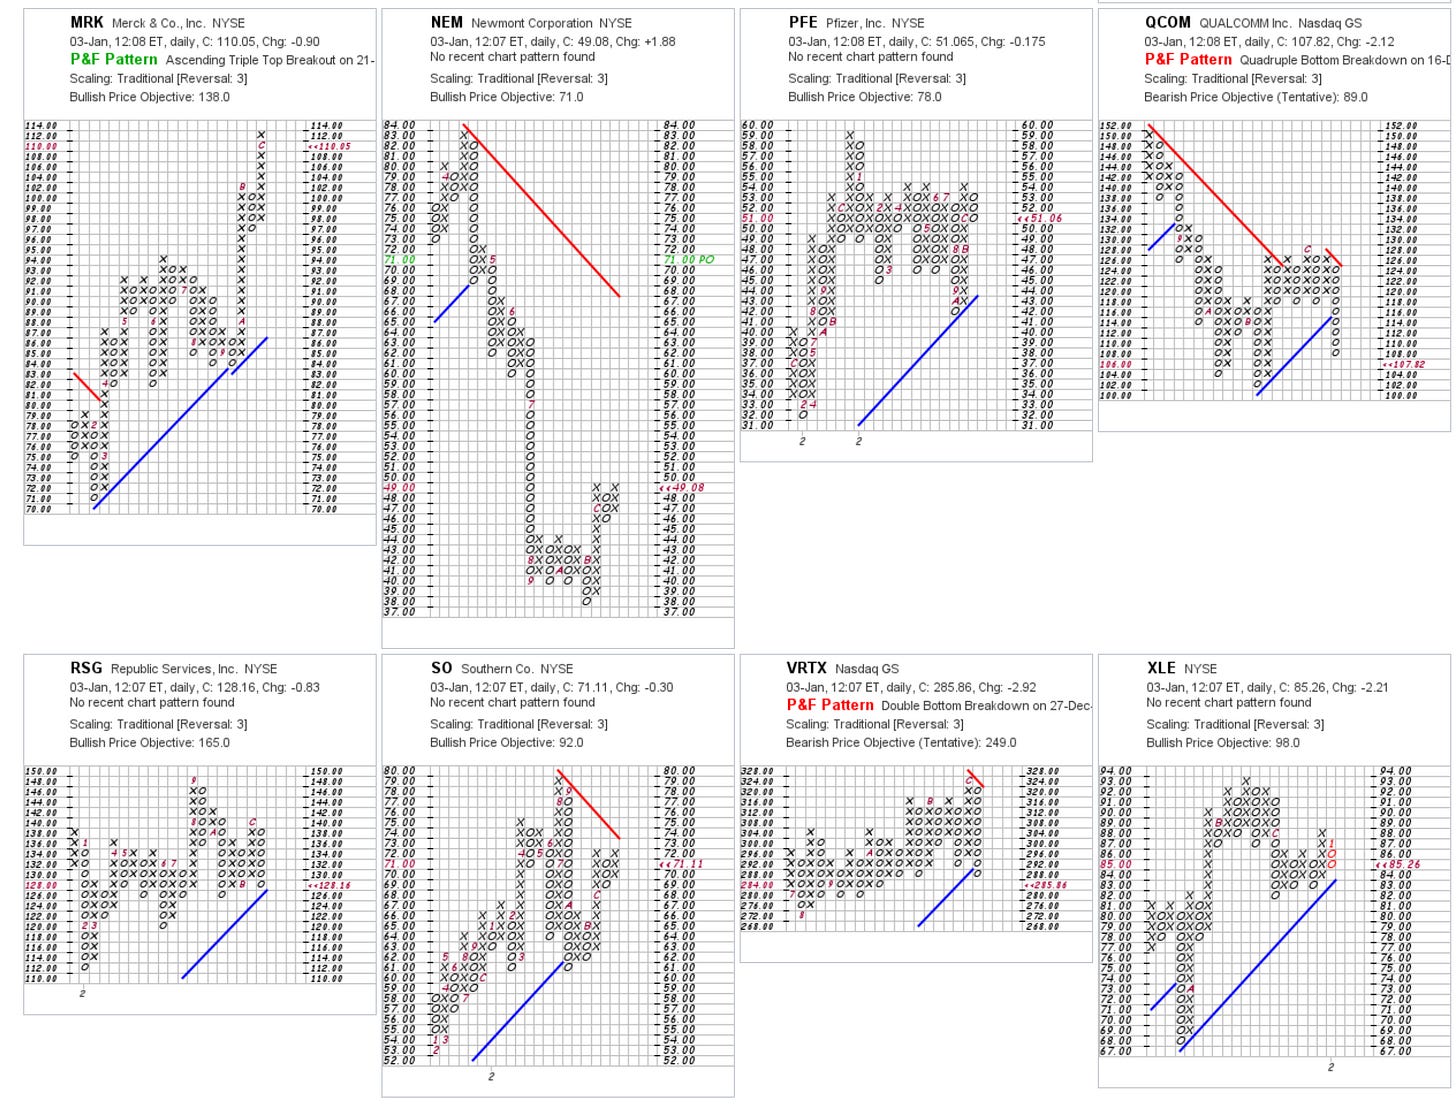
Sixteen of the 19 stocks and one ETF have bullish price objectives on their point and figure charts on StockCharts.com.
I own CAT, D, DGX, DOW, DUK, DVN, KMI, NEM, PFE, QCOM, SO AND VRTX. If the puts on these stocks are assigned, I’ll buy most of the stocks. When I did the trades, I do not expect them to be assigned.
The average price to free cash flow (P/FCF) ratio for the 19 stocks is a low 5.6. The portfolio is trading at 97% of fair value estimates and 11.8% below the mean consensus target prices. On average, the equities in this portfolio are trading 74% of the highest target price published by an analyst for each stock. Historically, analysts’ target prices fall as more earnings information and company guidance becomes available during the new year.
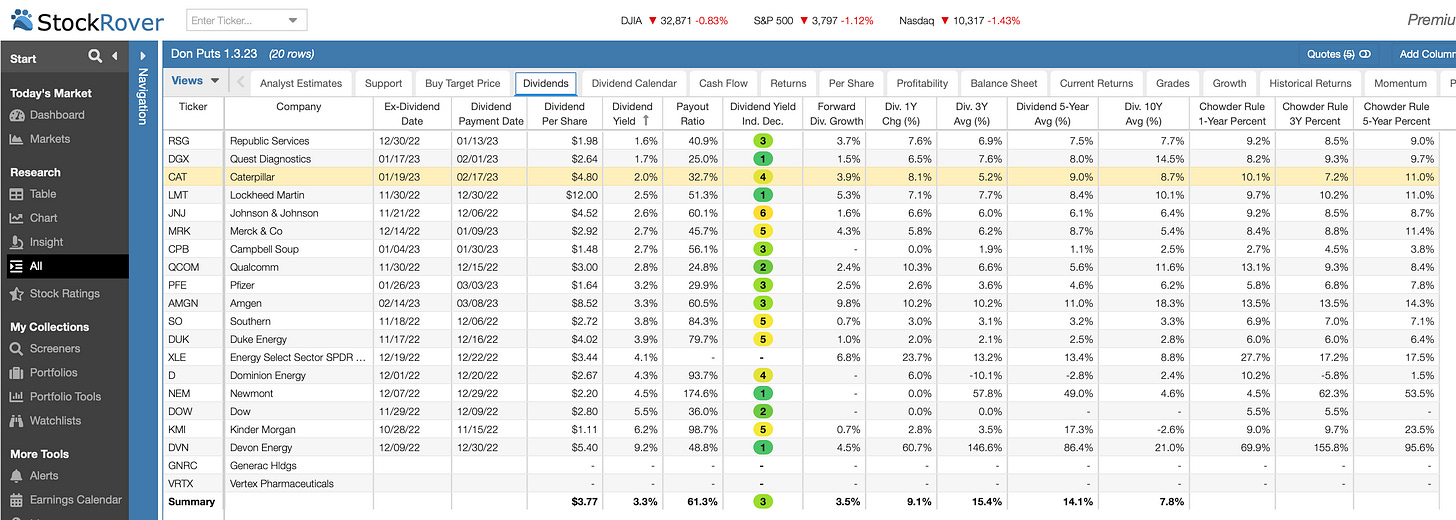
As a senior, I’m rebuilding my dividend portfolio. All but two of these equities pay dividends. The average dividend of the 18 dividend payers is 3.3%, compared with the average dividend yield of 2.6% for the 30 stocks in the Dow Jones Industrial 30 stocks. The average payout ratio is 61.3%. Their dividends are expected to rise 2.9%.
The average company in the portfolio returns 10.3% on assets, 35.6% on equity and 17% on investor capital. Those are good fundamentals.
This spreadsheet shows my cash secured puts as of January 3, 2023. In addition to looking at fundamentals and technical indicators when making trades, I check the margin of safety (MOS), Delta, probability that the stock will close out of the money (OTM) and unassigned, implied volatility (IV), year to date net debit, return on risk (RoR) and annualized return on risk (ARoR).
Besides serving as my puts trade calculator, the spreadsheet serves as my trade tracker during the year. I’ve been using versions of this spreadsheet since I began selling cash secured puts about 10 years ago. I’ve been trading covered calls since 2006.
LINKs:
Home Page. See previous articles on other trades, stocks and watch lists. If you read several of these articles, you’ll learn how my strategy is meant to work. No guarantees. Links to useful web sites are on the lower right corner of the home page. Scroll down.
Follow @realDonJohnson on twitter.com.
Selling in The Money Covered Calls Can Yield Big Annual Returns on Risk. By Donald E. L. Johnson
20 Ideas for Adjusting Your Stock and Bond Portfolio, by Christina Lourosa-Ricardo.
How to Beat Inflation Tax, Bear Market Tax With Dividend Stocks, Covered Calls, Cash Secured Puts, by Donald E. L. Johnson.
Wars Breed Inflation, Rising Interest Rates, Market Turmoil, By Donald E. L. Johnson.
Ways to use StockRover.com to analyze stocks
Calls vs Puts Options: What’s the Difference?
A video on how to place options trades on Think or Swim.


@ U.N. Owen. As my spreadsheet shows, the average MOS is 6.7%. And the average probability of the stocks closing OTM when the puts expire is 81.4%. The average delta is -16%.
I sold CAT puts with 7.5% and 11.6% MOS, which should be safe for 10-day trades unless the market collapses. My DOW MOS is 8% on 30- and 24-day trades. I'm more interested in buying more DOW shares at those strikes than I am interested in buying CAT at $225 and $215. I'd like to buy CAT at around $200 to $210. I had it called at $210.
JNJ is not very volatile so I sold its CSPs at a 3.8% MOS and a fairly safe -19% delta.
Each trade reflects my desire to buy a stock at the puts strike. The more interested I am in buying the stock, the lower the MOS and the OTM.
Is that how you trade puts? I'm looking to sell puts on a few more bullish DJIA stocks on this dip, but I'm not sure when I'll do that.
The Options Bible recommends that CSP Puts be sold in 45-day trades with about a 10% MOS. I prefer 15% to 20% MOS for 45-day and longer trades.
New subscriber here. Very much enjoying your work and how you share your thought process for each decision. Thanks for putting in all the time to write articles like these...i know that's not easy (or quick). Cheers!