

9 High Volatility Cash Secured Puts Trades
Higher volatilities give sellers of puts higher prices on puts options.

By Donald E. L. Johnson
Cautious Speculator
Consider selling out of the money, low delta puts to earn premium income.
This newsletter shows how speculators who want to sell options can generate good income at a relatively low risk of having the puts assigned.
The strategy is for traders who are reluctant to buy stocks in this market but would like to own all or some of these nine stocks at 10% to 15% discounts from their 4.25.25 closes.
Tables and charts show momentum, fundamentals, dividends and a range of potential returns on short-term duration puts options trades.
The stocks are shown at the top of the article because I’m not into teasing and making readers scroll to the bottom of the newsletter to see the lists of stocks.
Trading stocks and options is risky. Not trading them is another kind of risk.
Income traders of puts and calls can look at selling higher volatility puts to generate puts options premium incomes in put options trades that expire in May.
We are discussing trading cash secured puts on AFL, KO, LLY, MNDY, NEM, NFLX, VRTX and WMT. I own NEM and VRTX. Last week I discussed trading puts on nine “recession proof” stocks.
For example, Walmart (WMT) closed Friday at $95.09 per share and is down a bit in pre-market trading Sunday night. An income puts trader could sell WMT 5.9.25 (11 days) expiration at the $87 strike (8.5% discount from the current price).
The WMT 5.9.25 $87 strike puts options are $0.10 bid, $0.77 asked.
That’s a wide spread between bid and asked prices. Thus, this puts option is not very liquid. The mid point between the bid and ask is $0.44. Because it looks like WMT will be down in the morning, I might try to sell the puts contract for about $0.50 a share, or $50 per contract. Wait a few hours into the trading session before placing an order. You never know what may happen with tariffs.
If you decide to do a trade, watch the bid and ask action for five or 10 minutes. If the bid price is raised to $0.20 and the ask is changed to $0.45, decide if you want to ask, say $0.44 or $0.40 and see what happens to the bidding and asking numbers. If you don’t like the bid prices, let your offer sit for awhile and see what happens later in the day or cancel the order. And if there is more volume of trades at a nearby strike, cancel the order and try to trade another strike.
Sometimes you have to be flexible and patient while trying to get an order filled. And always diversify by selling one or two contracts on five or six stocks rather than betting on just one of them. The goal is to make money even though one of the trades has to be bought back at a loss or the stock’s puts are assigned.
Please click on images for better views. Data sources for all charts and tables: Barchart.com, StockCharts.com and Schwab.com.. Table by Donald E. L. Johnson with Anthropic.com’s Claude.ai. I invested three or four hours in gathering the data and working with Claude to get the tables I wanted. So far I”ve spent about three hours writing and editing.
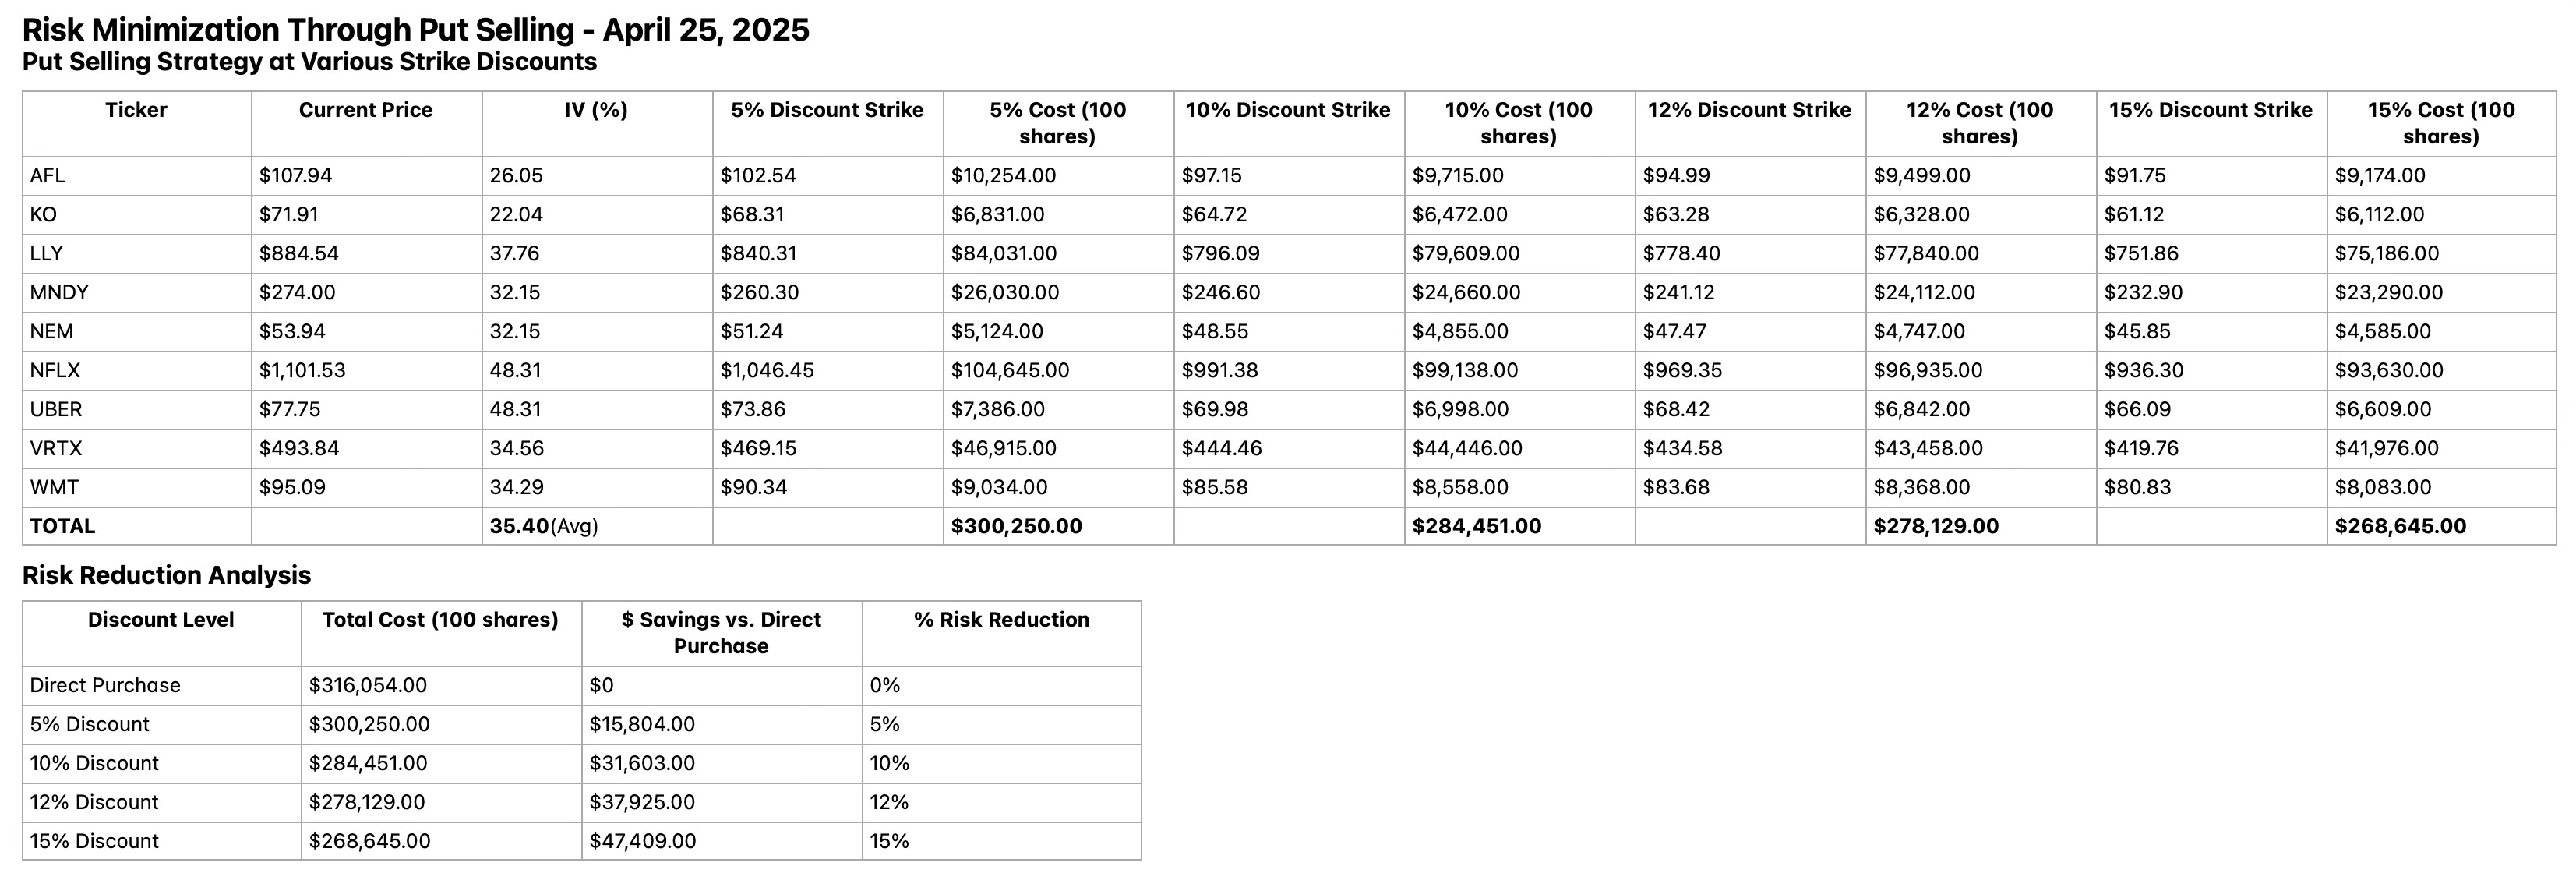
The table above shows that if a trader buys 100 shares of each of these stocks, the total cost will be about $316,054. If the nine stocks are sold at strikes 5% below last Friday’s closing prices, the trader will put up about $300,250 in margins to secure the puts. A 15% strike discount would require a $268,645 margin. That would be about $47,409 less than the cost of an outright purchase.
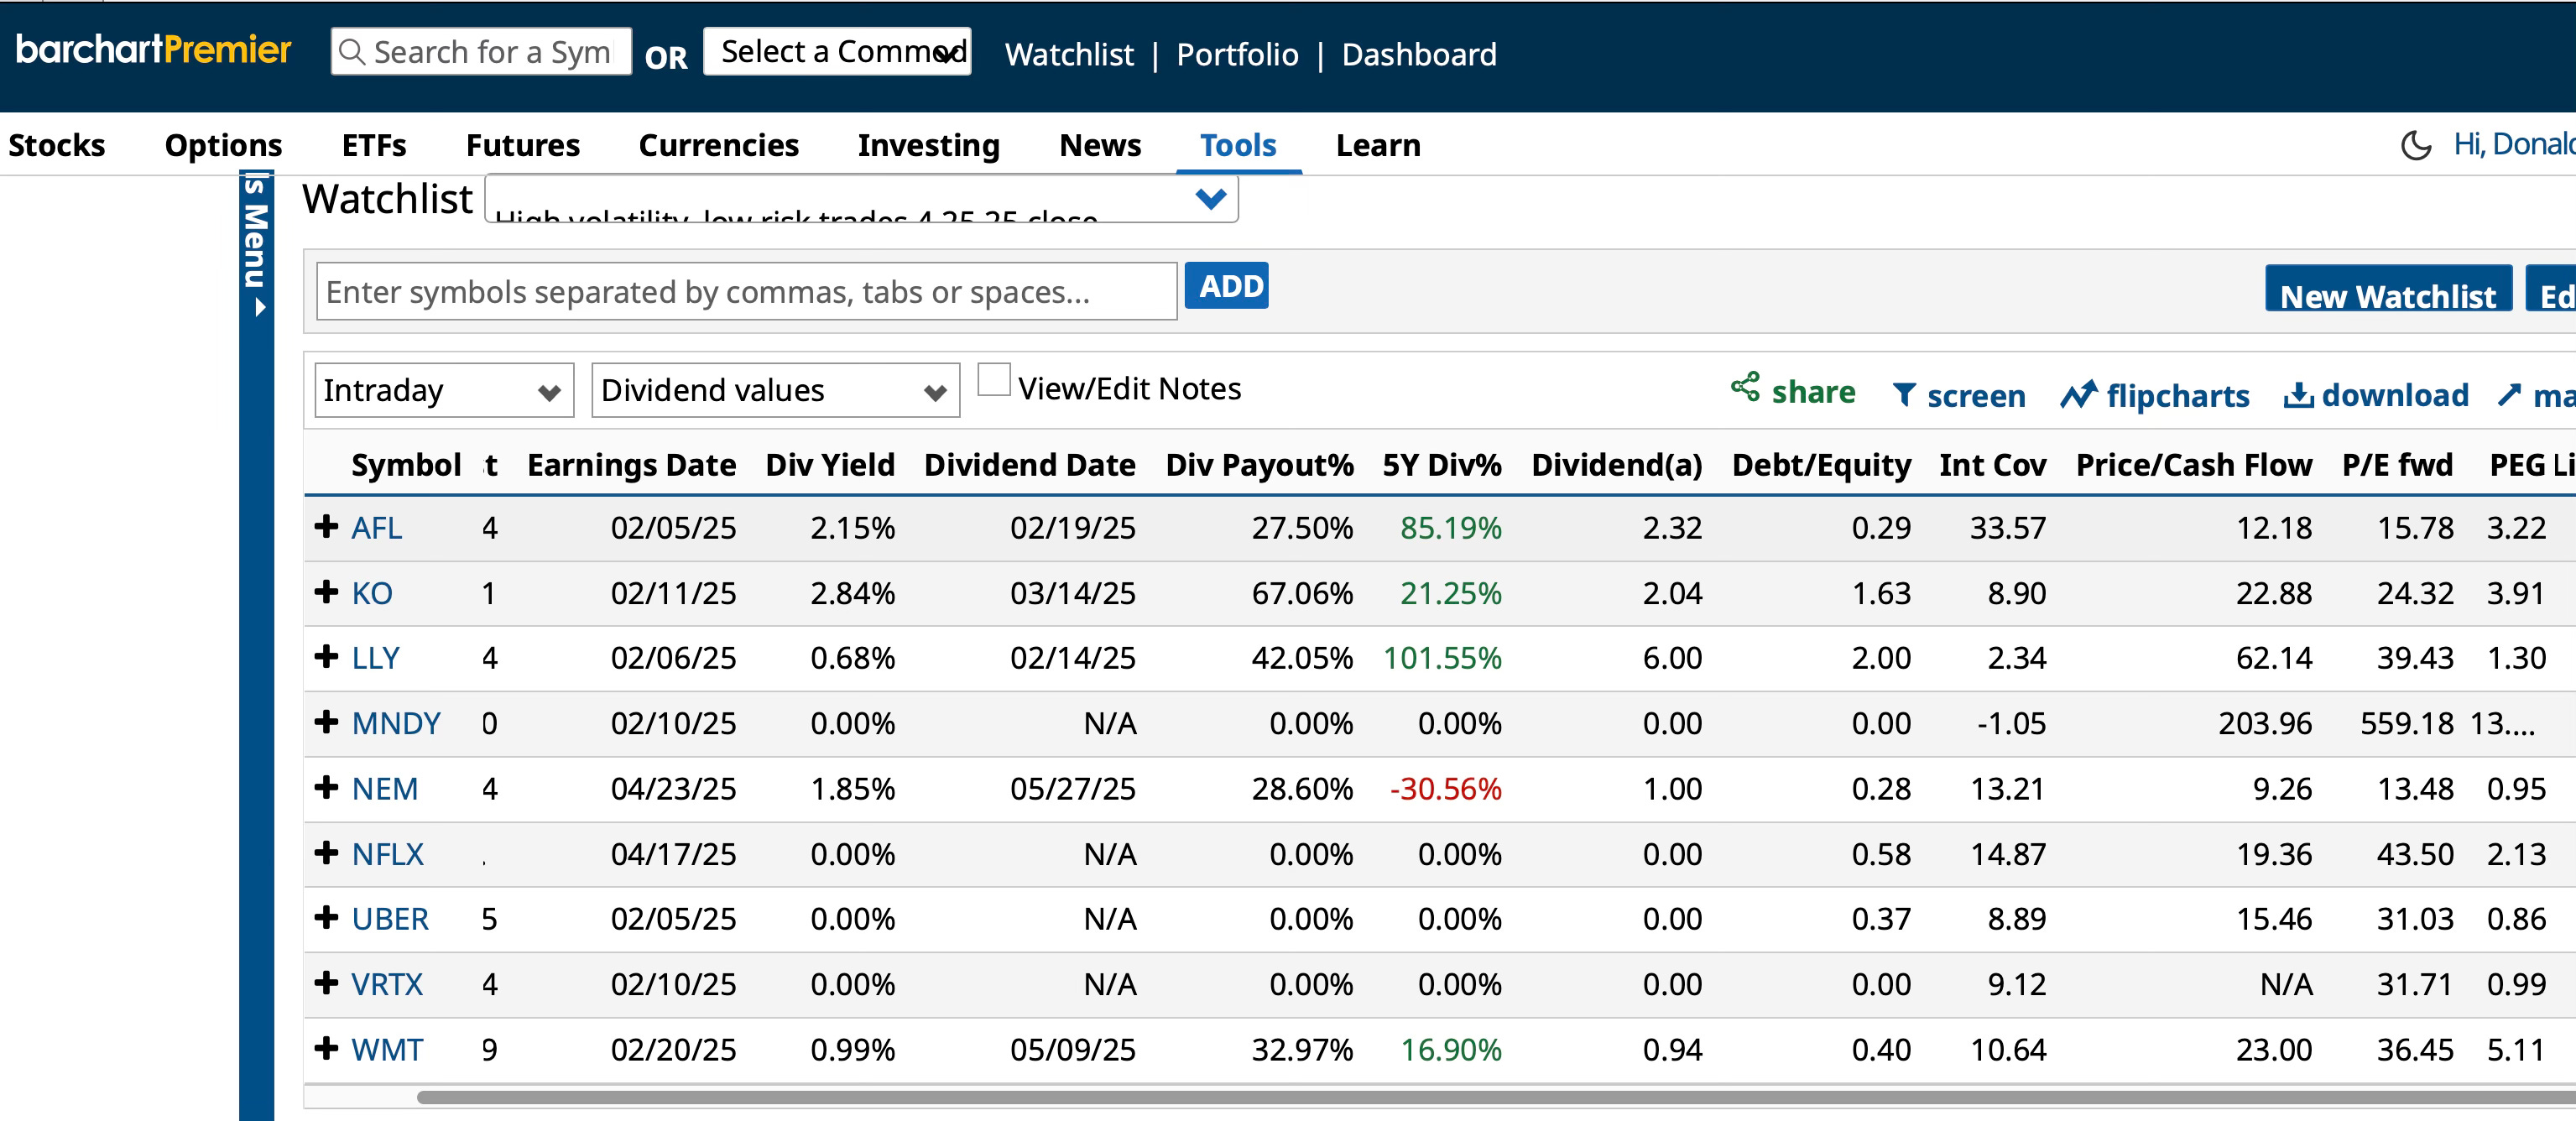
This Barchart.com table shows that six of the nine stocks have reported first quarter earnings. Aflac (AFL) and Uber (UBER) earnings are due on 5.05.25, give or take. That makes trading them before they report riskier. VRTX and WMT report in about two or three weeks.
The table also shows ex-dividend dates and yields and payout ratios. Several of the stocks don’t pay dividends. Except for Coca Cola (KO), debt to equity ratios look safe. MNDY has high price to cash flow and price/earnings ratios. It’s very speculative.
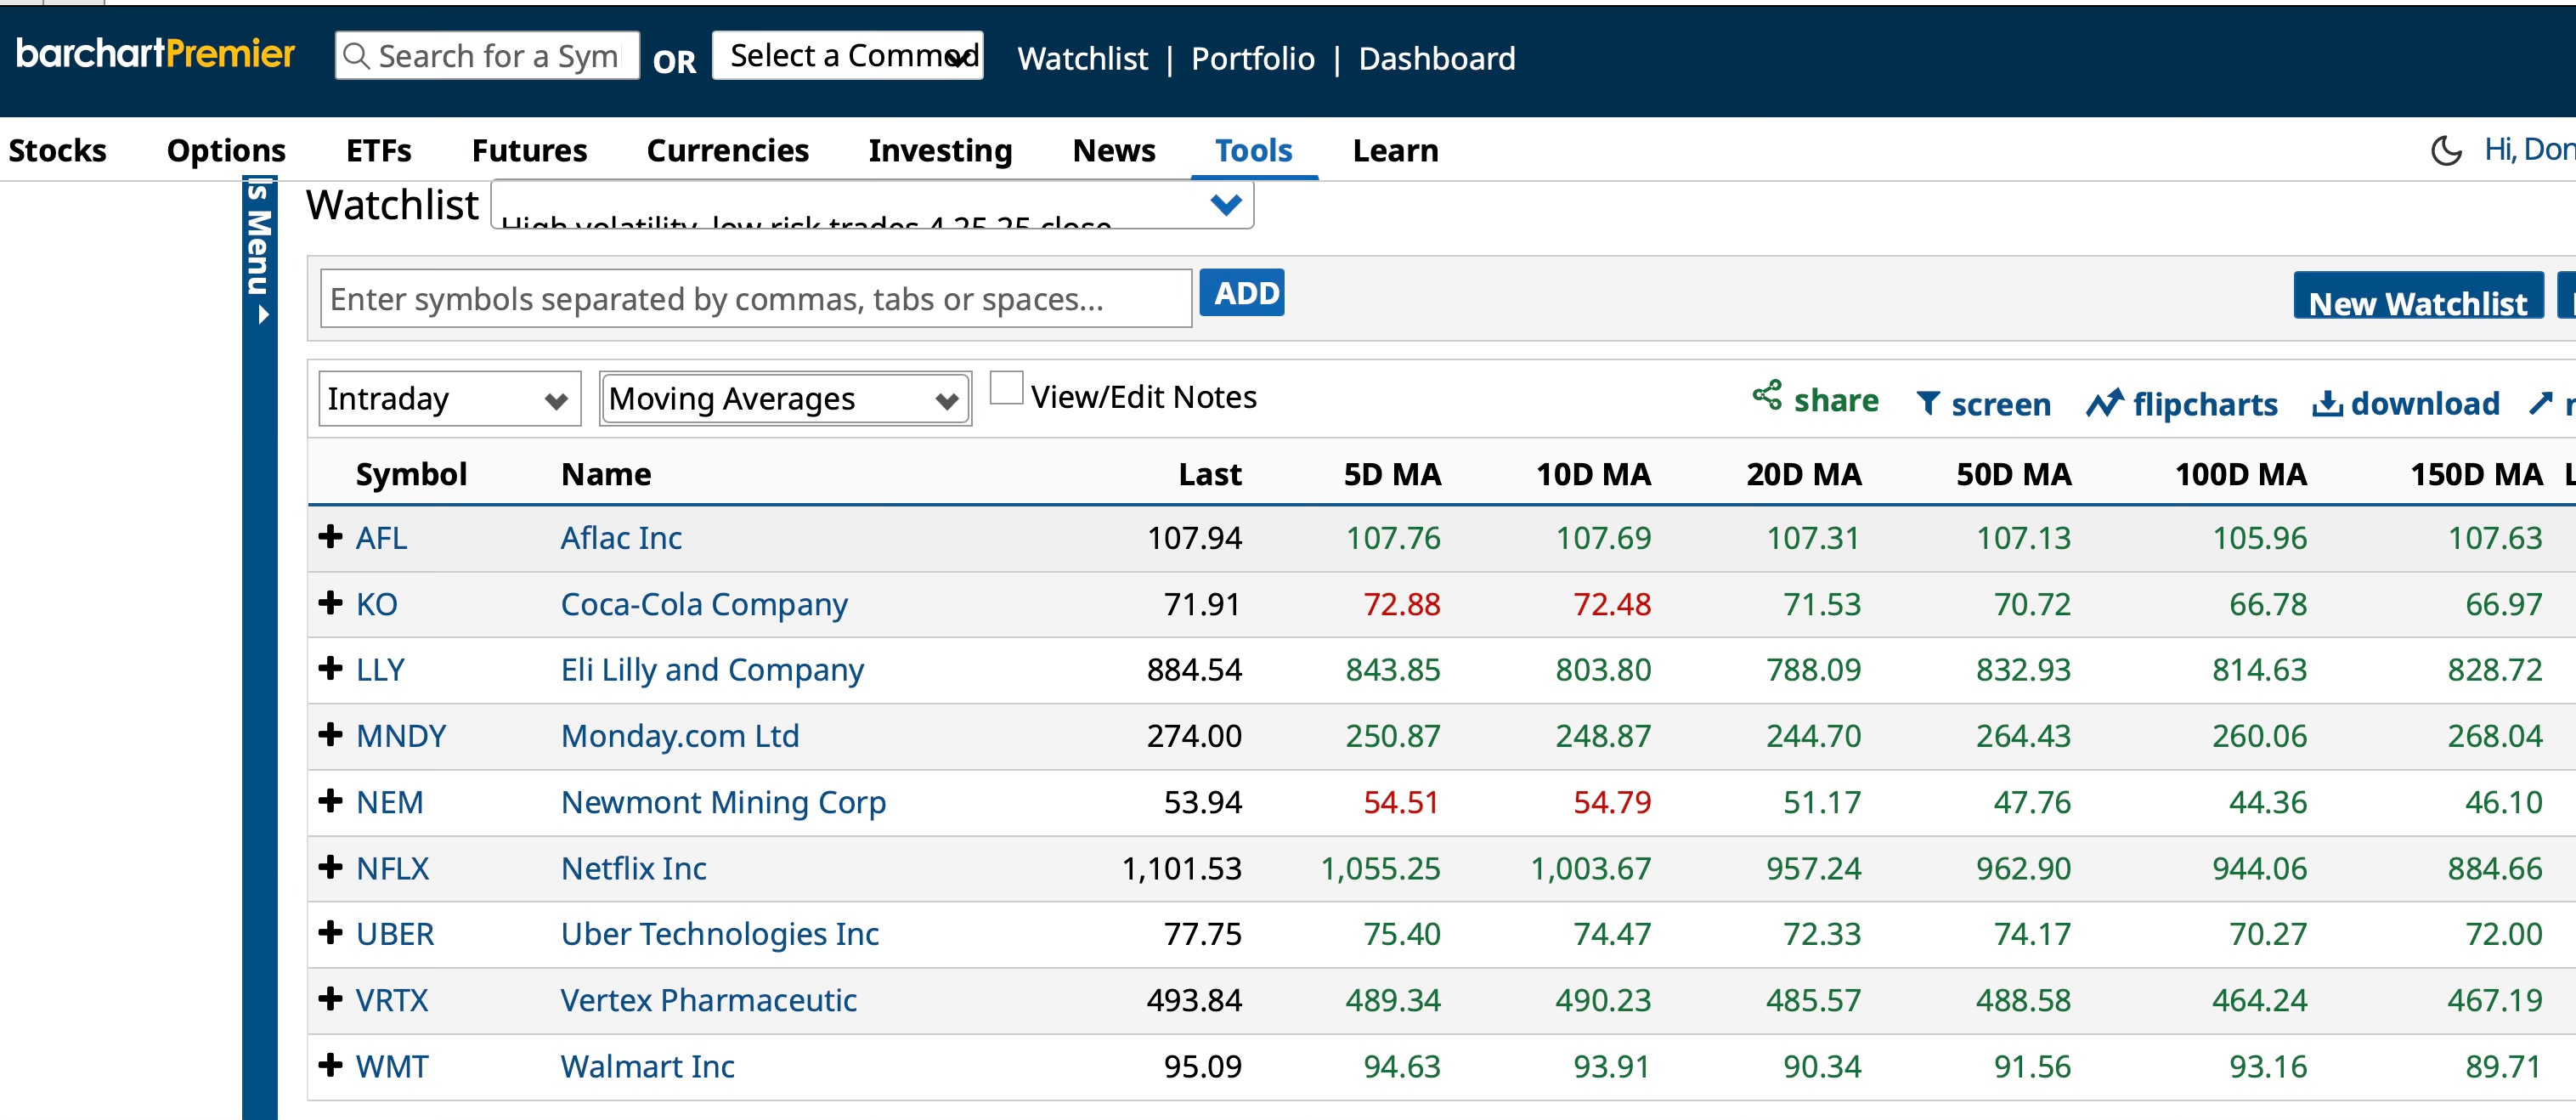
All of these stocks have good bullish momentum. This table shows that they are trading above their 50 day moving averages.
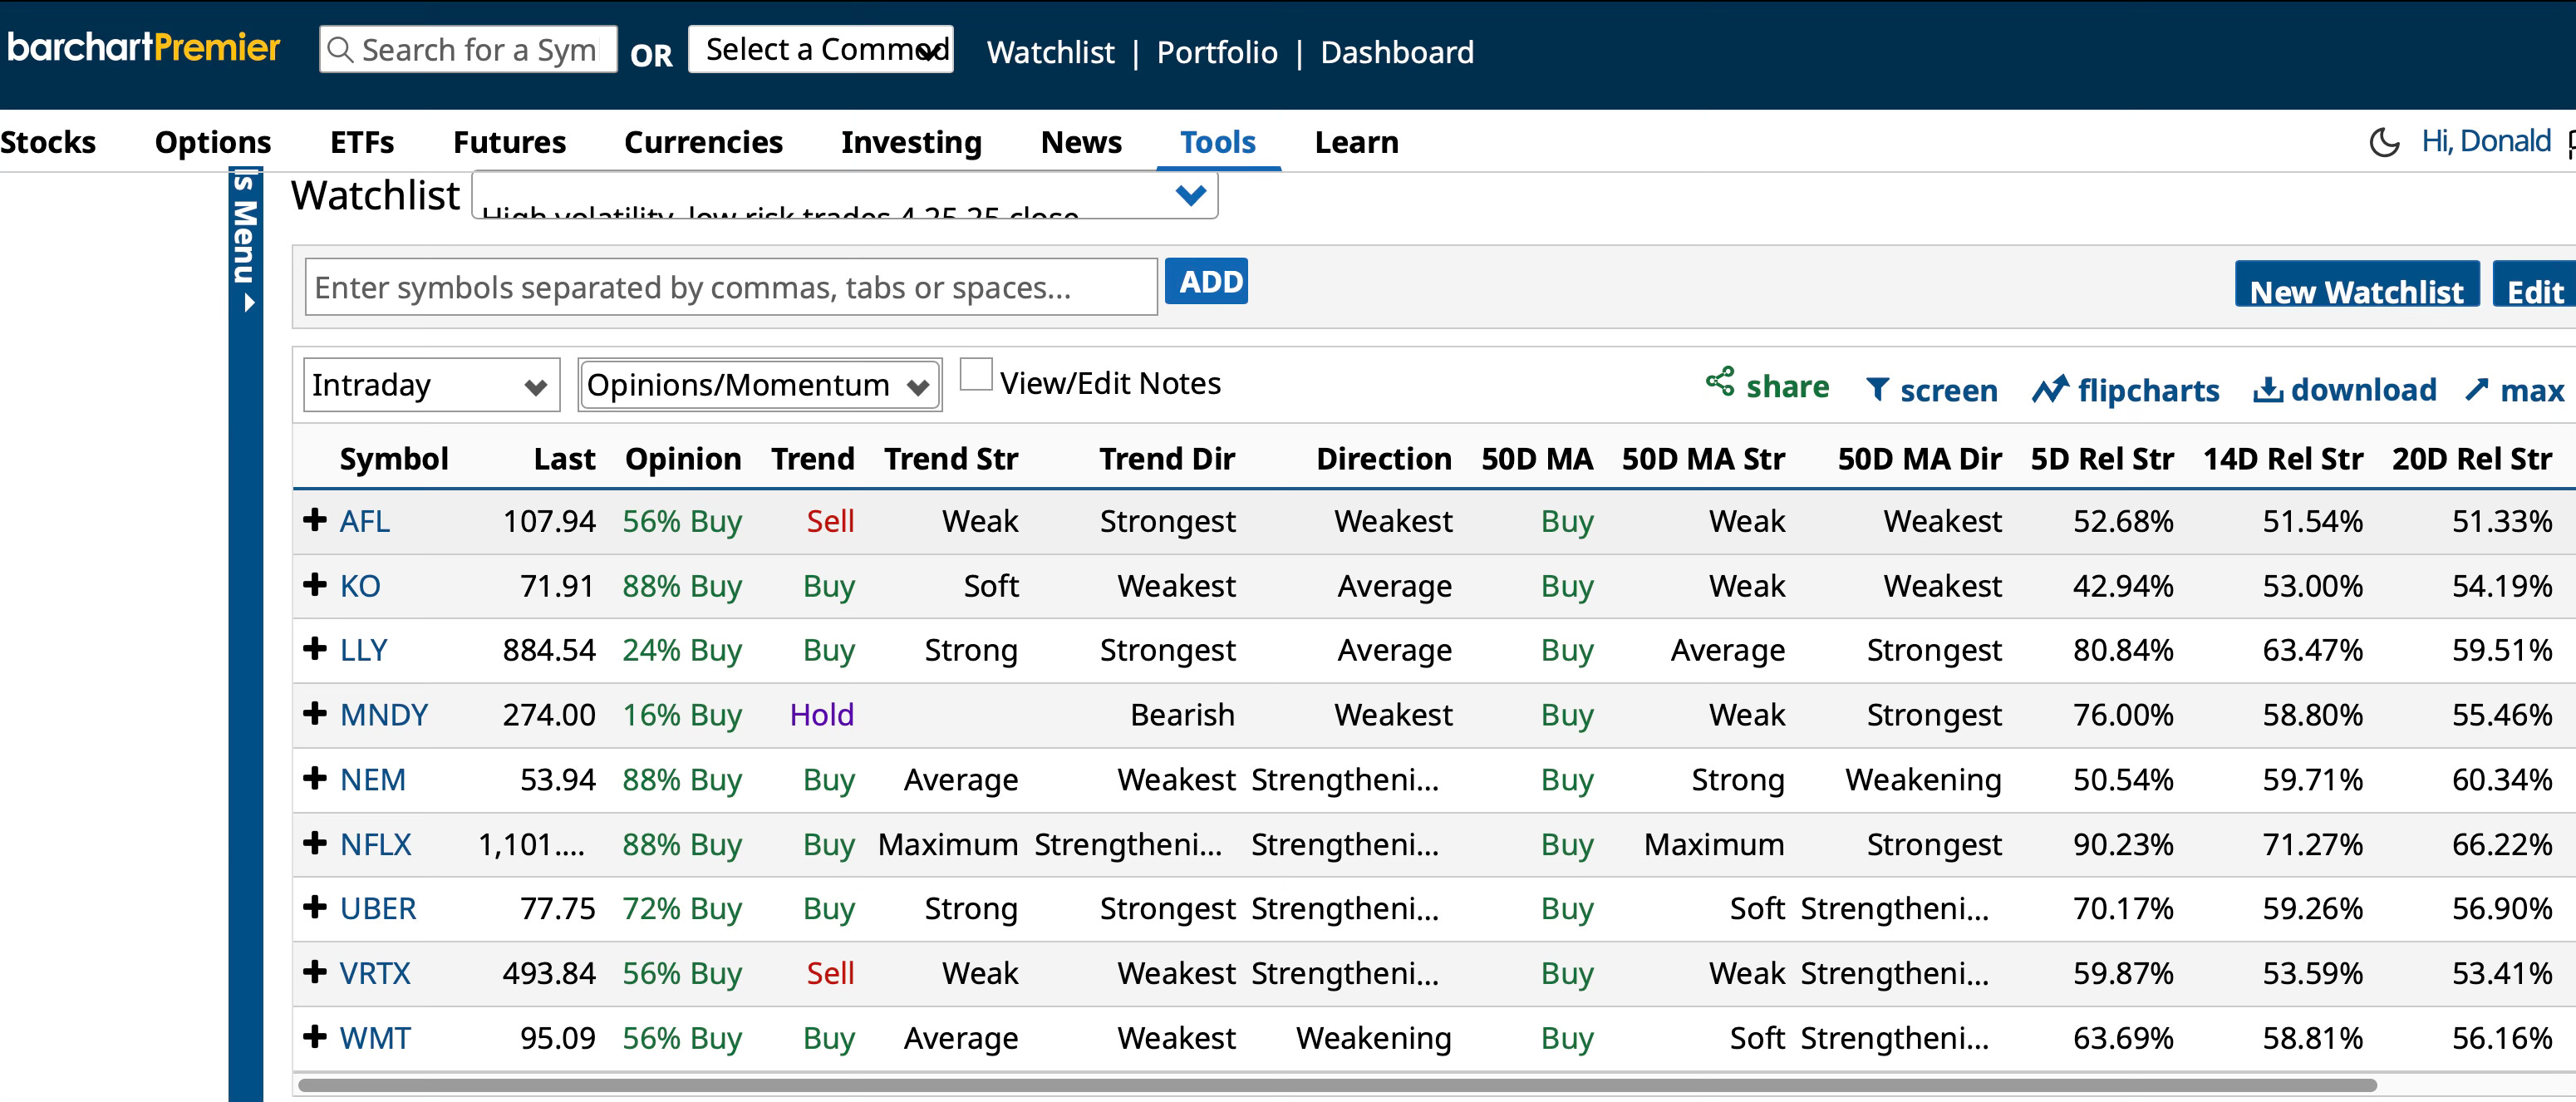
Barchart.com averages 13 momentum indicators. These stocks are rated between 16% buys and 88% buys.
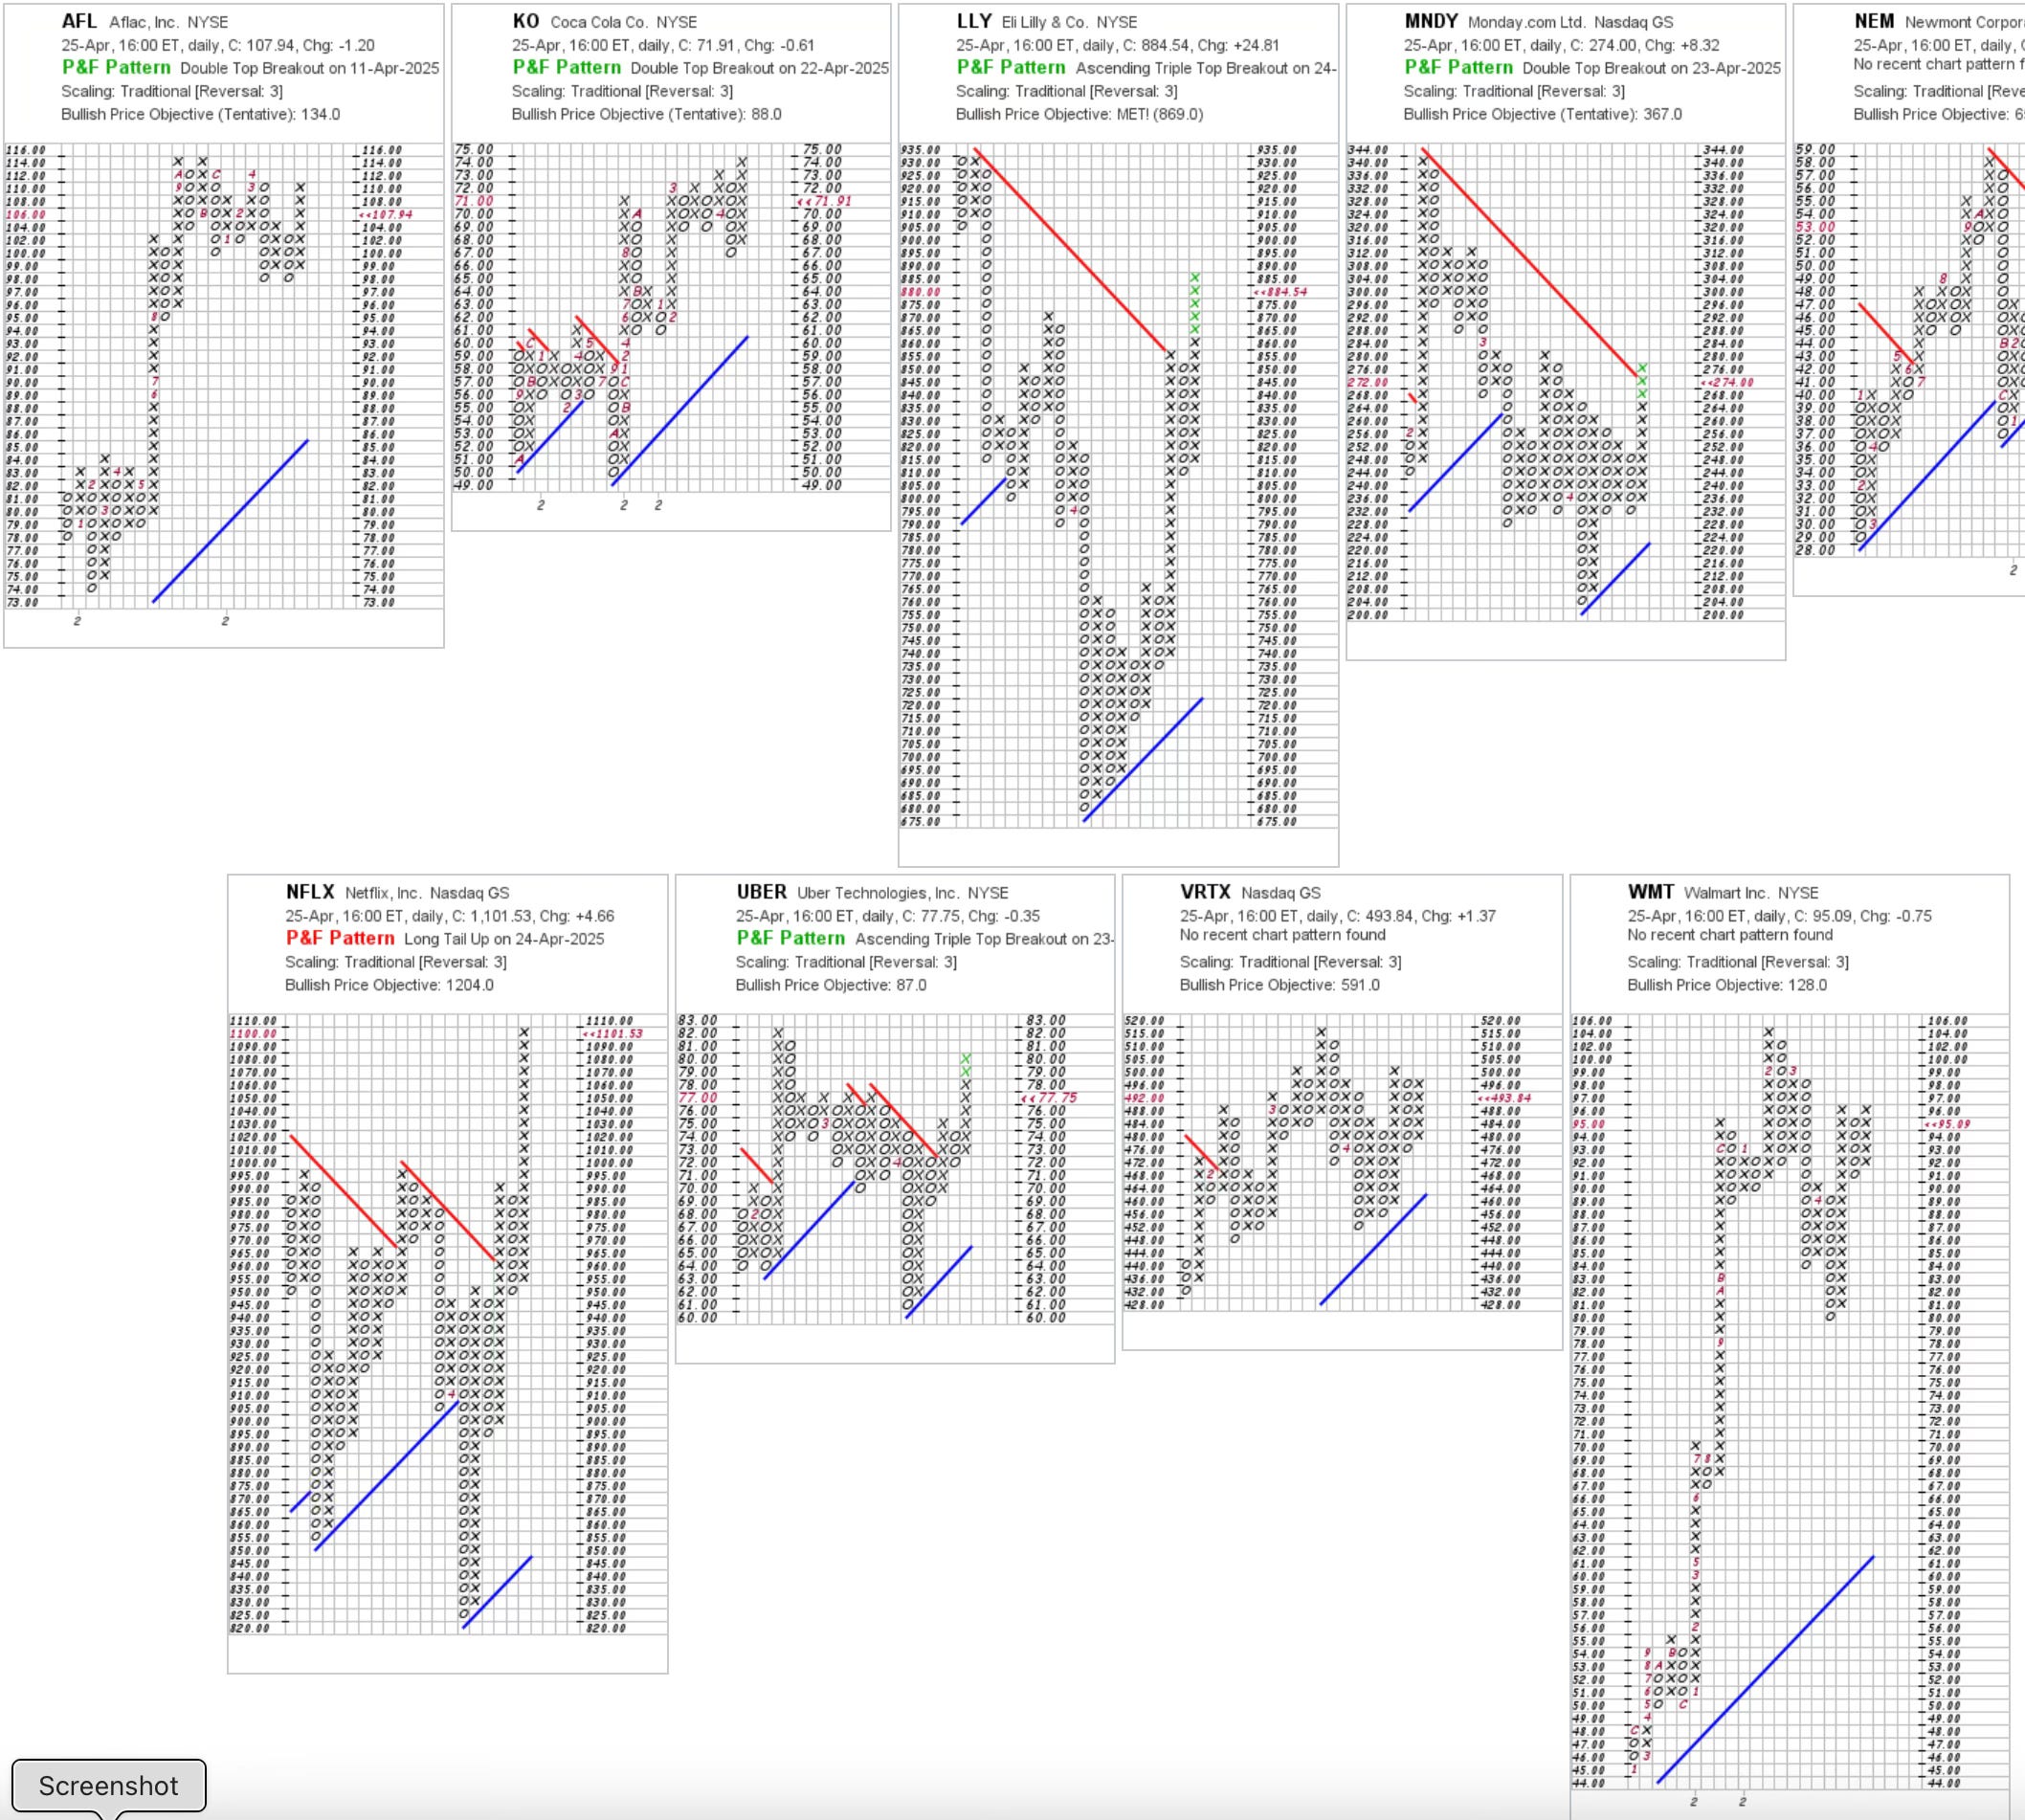
Point and figure charts from StockCharts.com show their bullish price objectives. PnF charts reflect recent price movements. I think they are more helpful than what we get from analysts who tend to be too optimistic. Of course, stocks can sink over night. These are price objectives, not price targets.
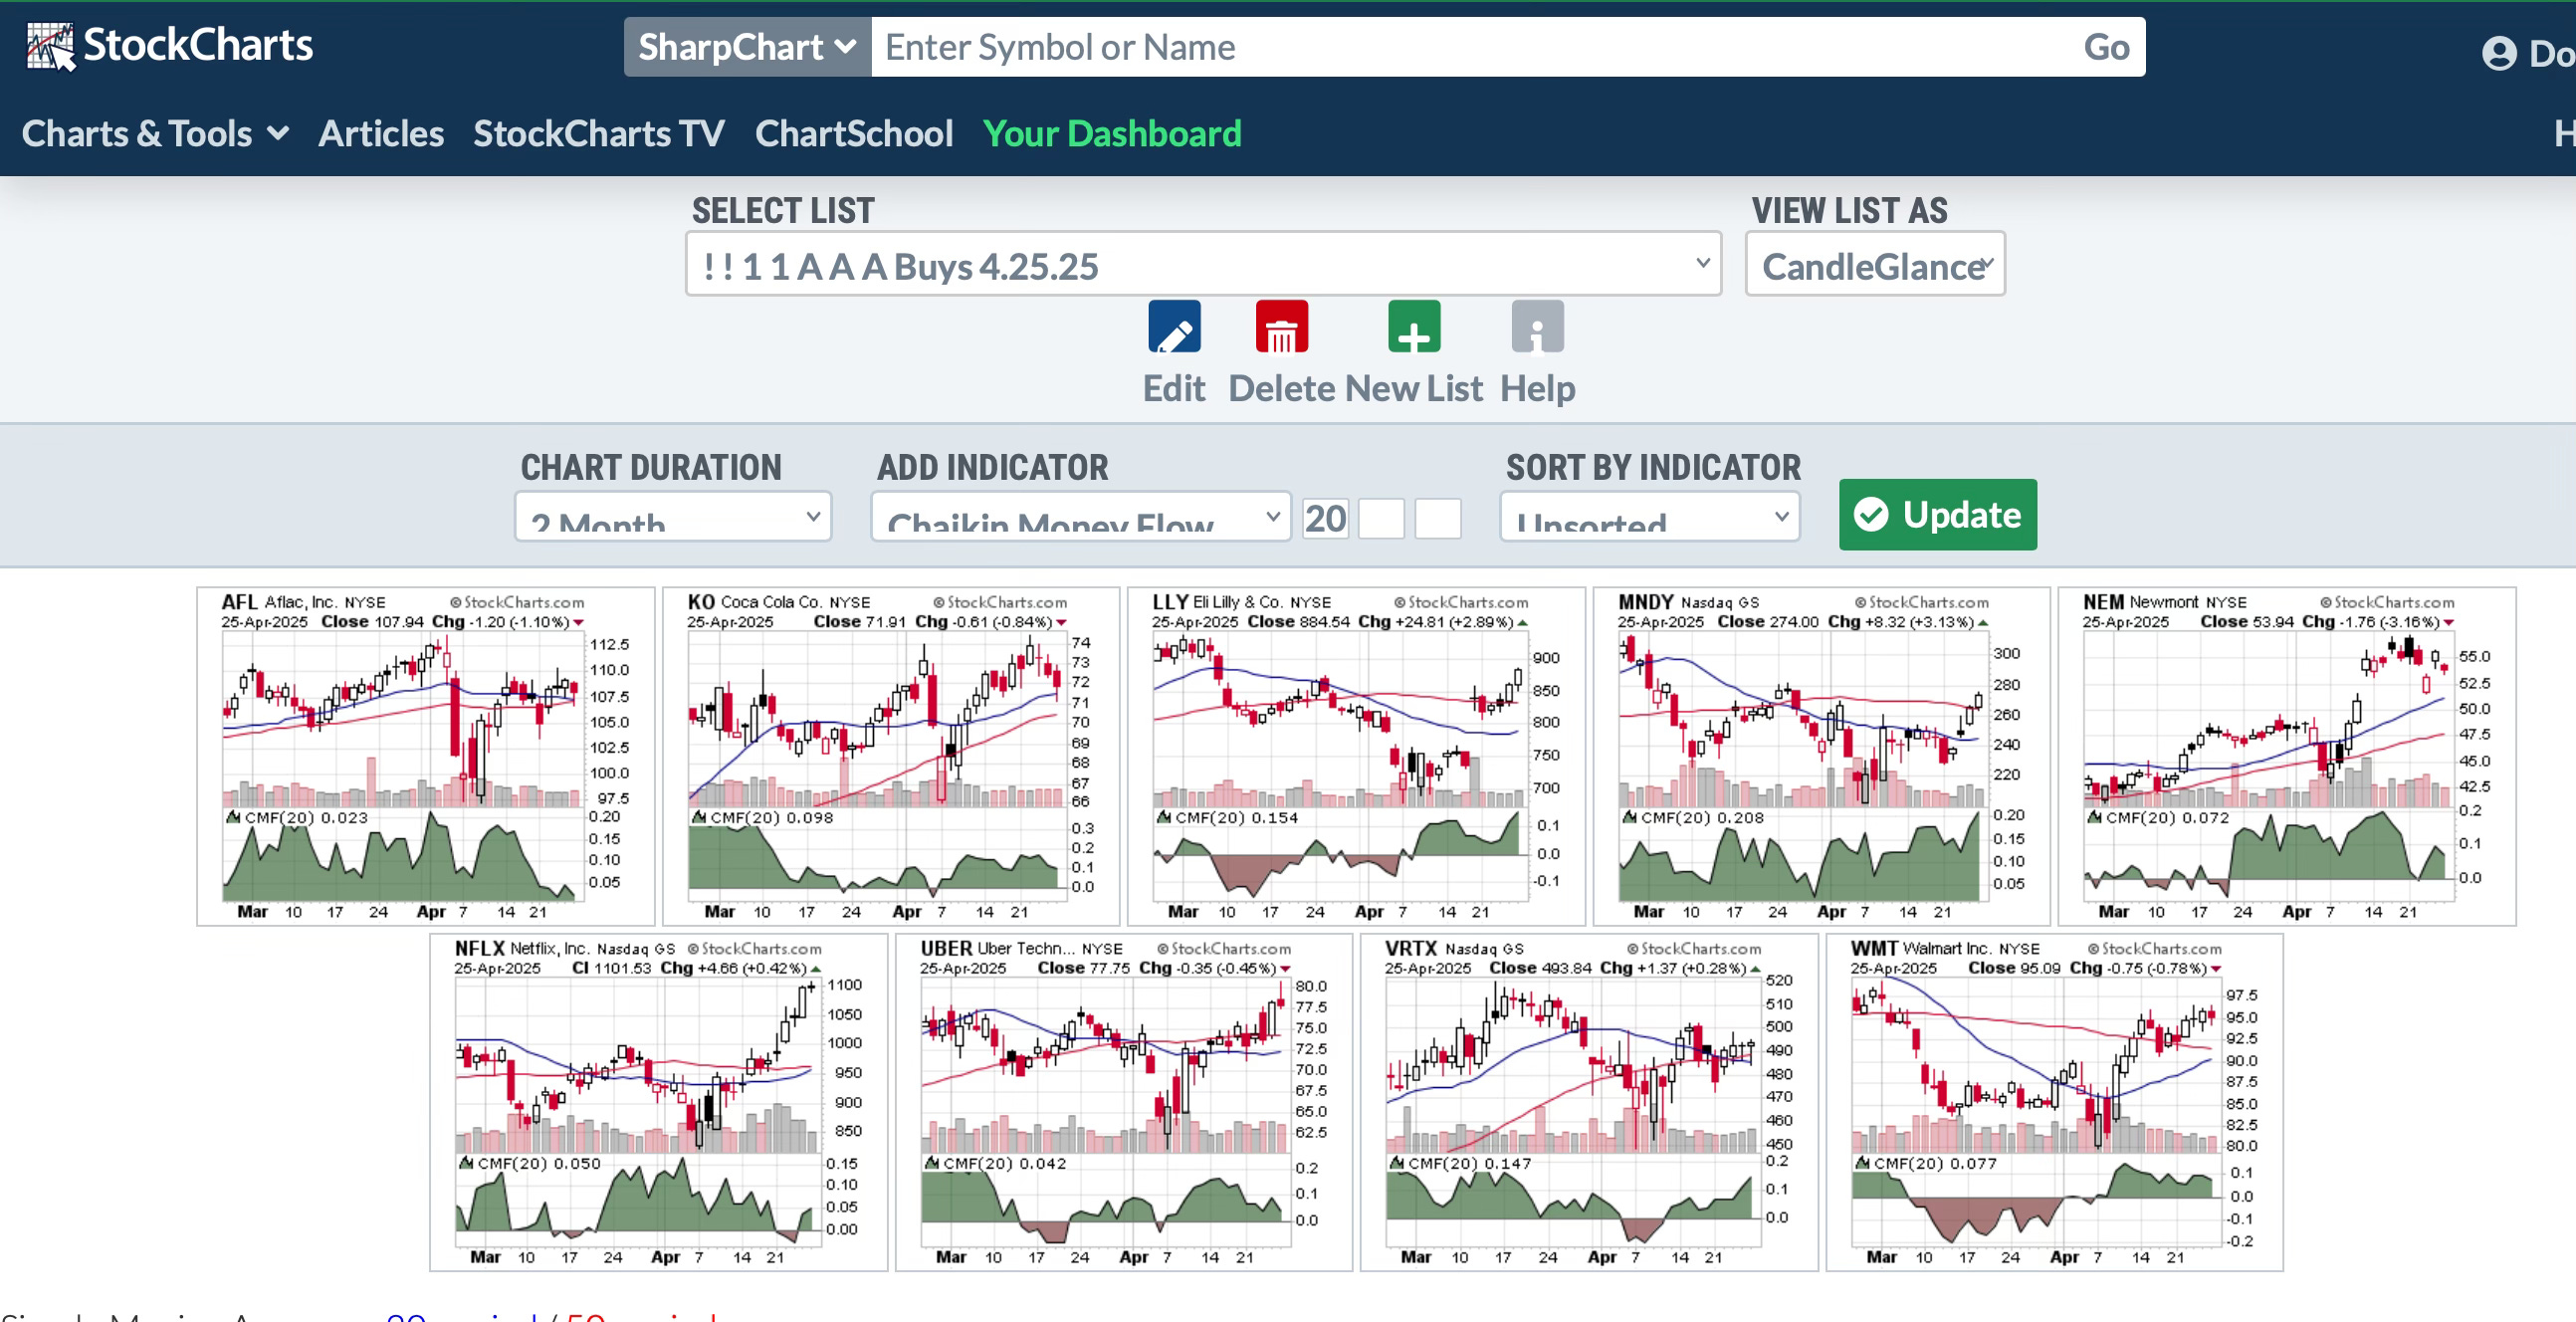
Positive Chaikin Money Flows are bullish. These StockCharts.com charts show that big investors are buying these nine stocks.
With the market’s current volatility, consider the stocks mentioned here as a buy watch list. You don’t have to do the trades right away or at all.
Do you look at the tables and charts? Do they help you make trading decisions? Would you prefer fewer illustrations? How can we improve this presentation?
Thank you for the article. I've been nervous this year about actively trading, but you have motivated me to get back into the game. What do you think about using put credit spreads?
Thanks for the analysis- I’ll check out those names later, generally I would probably not trade WMT with the spreads you discussed. Some of your names look as though they may be quite profitable quickly if they reach and stay above the critical EMAs, let’s see. Thanks